Monday, March 20, 2017

Lab 7

LAB 7 Joining Data with North & South Dakota 

The map below is a representation of US counties with study areas of North and South Dakota along with three other states chosen as a shape file process in Esri.

The projection chosen for this map is the NAD 1983 State Plane for North Dakota because the coordinate system is designed for the specific region of North Dakota. North and South Dakota are longer in the east west direction therefore the Lambert Conformal Conic was used. 


A .xls file is a file extension for a spreadsheet file format created by Microsoft for use with Microsoft Excel.

Selecting by attribute is selecting geographic features in GIS, which contains non-spatial information that is usually stored in a table and linked to the feature by a unique identifier.

A field is a column in a table that stores the values for a single attribute.

A record is a set of related data fields, often a row in a database, containing all the attribute values for a single feature.

An attribute is non-spatial information about a geographic feature in a GIS, usually stored in a table and linked to the feature by a unique identifier.

A relational Database is a data structure in which collections of tables are logically associated with each other by shared fields.


The field calculator allows you to calculate area, length, perimeter, and other geometric properties on fields in attribute tables.


Monday, March 6, 2017

Lab 6 Introduction to ArcGIS

Boston Area Zip Codes and Highway


The map document is a representation of Massachusetts interstate highways and the zip codes they run through in the Boston area. The table of contents in ArcGIS is a tabbed list of data frames and layers on a map that shows how the data is symbolized, the source of the data, along with whether or not each layer is selective. 

A data frame is a map element that defines the page extent, the geographic extent and other properties that consist of layers in the table of contents. A data-set can be represented in one or more data frames as well. 

map layer are groups of point, line, or polygon features representing a particular class or type of real-world entities such as population, roads, or postal codes. A layer contains the visual representation of each feature.

An attribute table is a data-set containing information about geographic features, usually arranged so that each row represents a feature and each column represents one feature attribute. 


Black Communities in Boston Area 


The map above is a representation of the black communities in the Boston area where graduated symbols represent the density of the back population. 

Some issues that I explored on the Esri site are slow performance and after adding several data-sets to an ArcMap Data Frame, features in some layers do not align correctly with other layers. I have experienced the both issues addressed on the site as many others and it converts an easy task to a difficult one. 

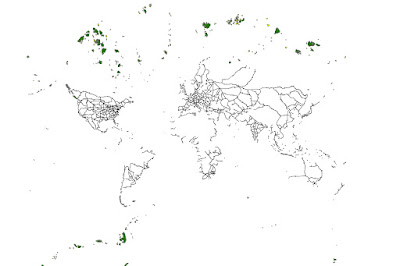
Lab 6 World Map

World Map

The world map can be seen in other ways such as railroads and islands. The attributes in this world map are major railroads in the world, which outline the shape of the continent. The median and large islands help portray Greenland and and parts of Alaska as well. the world can be seen from a different perspective and yet be identified.